Home/Movements/
Mile Run

Conditioning Movement

Mile Run

The one-mile run is a classic measure of aerobic capacity and running economy. Time-based standards reflect what trained athletes can hold across a single 1,609-meter effort.

Category

Aerobic Endurance

Equipment

Track or measured course

Muscles Worked

Quadriceps, Hamstrings, Calves, Glutes, Cardiovascular system

Back Squat standards by age and level — male

Beginner(Score 0–49)Intermediate(Score 50–70)Advanced(Score 71–89)Elite(Score 90–100)
AgeBeginner (Score 0–49)Intermediate (Score 50–70)Advanced (Score 71–89)Elite (Score 90–100)

Each cell shows the finishing-time range (m:ss) that places a runner inside that level for the given age group. Lower is better; Elite is the score-90 anchor and faster.

What do these levels mean?

Beginner (0–49): Below the 64th percentile — a typical starting point in the first months of training.

Intermediate (50–70): About the 64th to 82nd percentile. Roughly 1–2 years of focused, consistent training.

Advanced (71–89): About the 83rd to 94th percentile. Typically 3–5+ years of dedicated programming.

Elite (90–100): About the 94th percentile and above, up to the top of the table. Competition-level capacity built over many years.

Mile Run
Female
70-74
11
21:22
18:01
21:21
16:14
18:00
16:13
Mile Run
Female
65-69
10
17:11
14:30
17:10
13:03
14:29
13:02
Mile Run
Female
60-64
9
14:23
12:07
14:22
10:55
12:06
10:54
Mile Run
Female
55-59
8
12:22
10:25
12:21
9:23
10:24
9:22
Mile Run
Female
50-54
7
10:51
9:08
10:50
8:13
9:07
8:12
Mile Run
Female
45-49
6
9:46
8:14
9:45
7:25
8:13
7:24
Mile Run
Female
40-44
5
8:42
7:20
8:41
6:36
7:19
6:35
Mile Run
Female
35-39
4
8:15
6:57
8:14
6:16
6:56
6:15
Mile Run
Female
30-34
3
8:00
6:44
7:59
6:05
6:43
6:04
Mile Run
Female
25-29
2
7:55
6:40
7:54
6:01
6:39
6:00
Mile Run
Female
18-24
1
8:07
6:50
8:06
6:06
6:49
6:05
Mile Run
Male
70-74
11
18:48
15:51
18:47
14:16
15:50
14:15
Mile Run
Male
65-69
10
15:07
12:45
15:06
11:29
12:44
11:28
Mile Run
Male
60-64
9
12:39
10:40
12:38
9:37
10:39
9:36
Mile Run
Male
55-59
8
10:52
9:10
10:51
8:15
9:09
8:14
Mile Run
Male
50-54
7
9:32
8:02
9:31
7:15
8:01
7:14
Mile Run
Male
45-49
6
8:35
7:15
8:34
6:32
7:14
6:31
Mile Run
Male
40-44
5
7:39
6:27
7:38
5:49
6:26
5:48
Mile Run
Male
35-39
4
7:15
6:07
7:14
5:31
6:06
5:30
Mile Run
Male
30-34
3
7:02
5:56
7:01
5:21
5:55
5:20
Mile Run
Male
25-29
2
6:58
5:53
6:57
5:18
5:52
5:17
Mile Run
Male
18-24
1
7:08
6:01
7:07
5:22
6:00
5:21

Where do you land?

Know where you are. Know what to do next.

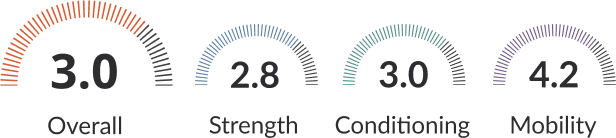
These standards show the bands. Your CompTrain Fitness Level shows exactly where you sit across strength, conditioning, and mobility — then points you toward the training that moves you forward.

Get your Fitness Level →

100% free to start · No credit card required

About this data

Each level represents a band of CompTrain Fitness Scores (0–100). The range shown in each cell is the lower and upper finishing time bound that places someone inside that band for their age group. Mile-time thresholds calibrated to CompTrain Fitness Score anchors (Beginner = 0, Intermediate = 50, Advanced = 71, Elite = 90). Lower times indicate greater capacity. Values are aggregated from publicly available strength and conditioning datasets, peer-reviewed normative research (e.g. ExRx, USAPL/IPF age-graded coefficients, ACSM aerobic norms), and calibrated against CompTrain's proprietary dataset of athlete performance. These are general guidelines — individual results vary based on training history, biomechanics, and other factors. Want to see exactly where you land across strength, conditioning, and mobility? Check your CompTrain Fitness Level →.


runner
finishes the mile in
advanced runners finish in
time